1. Environmental Radiological Surveillance around Nuclear Power Plants across the country
2. Environmental Radioactivity Monitoring and Surveillance around BARC facilities at Trombay and Visakhapatnam
3. Environmental Gamma radiation monitoring around all DAE facilities across the country using TLDs
4. Design and Development of Environmental Radiation Monitoring Systems
5. Establishment of countrywide Environmental Radiation Monitoring Network under IERMON
6. Environmental Monitoring, Assessment and Modeling of Radioactive and Non-Radioactive contaminants
7. Capacity building for nuclear forensic analysis
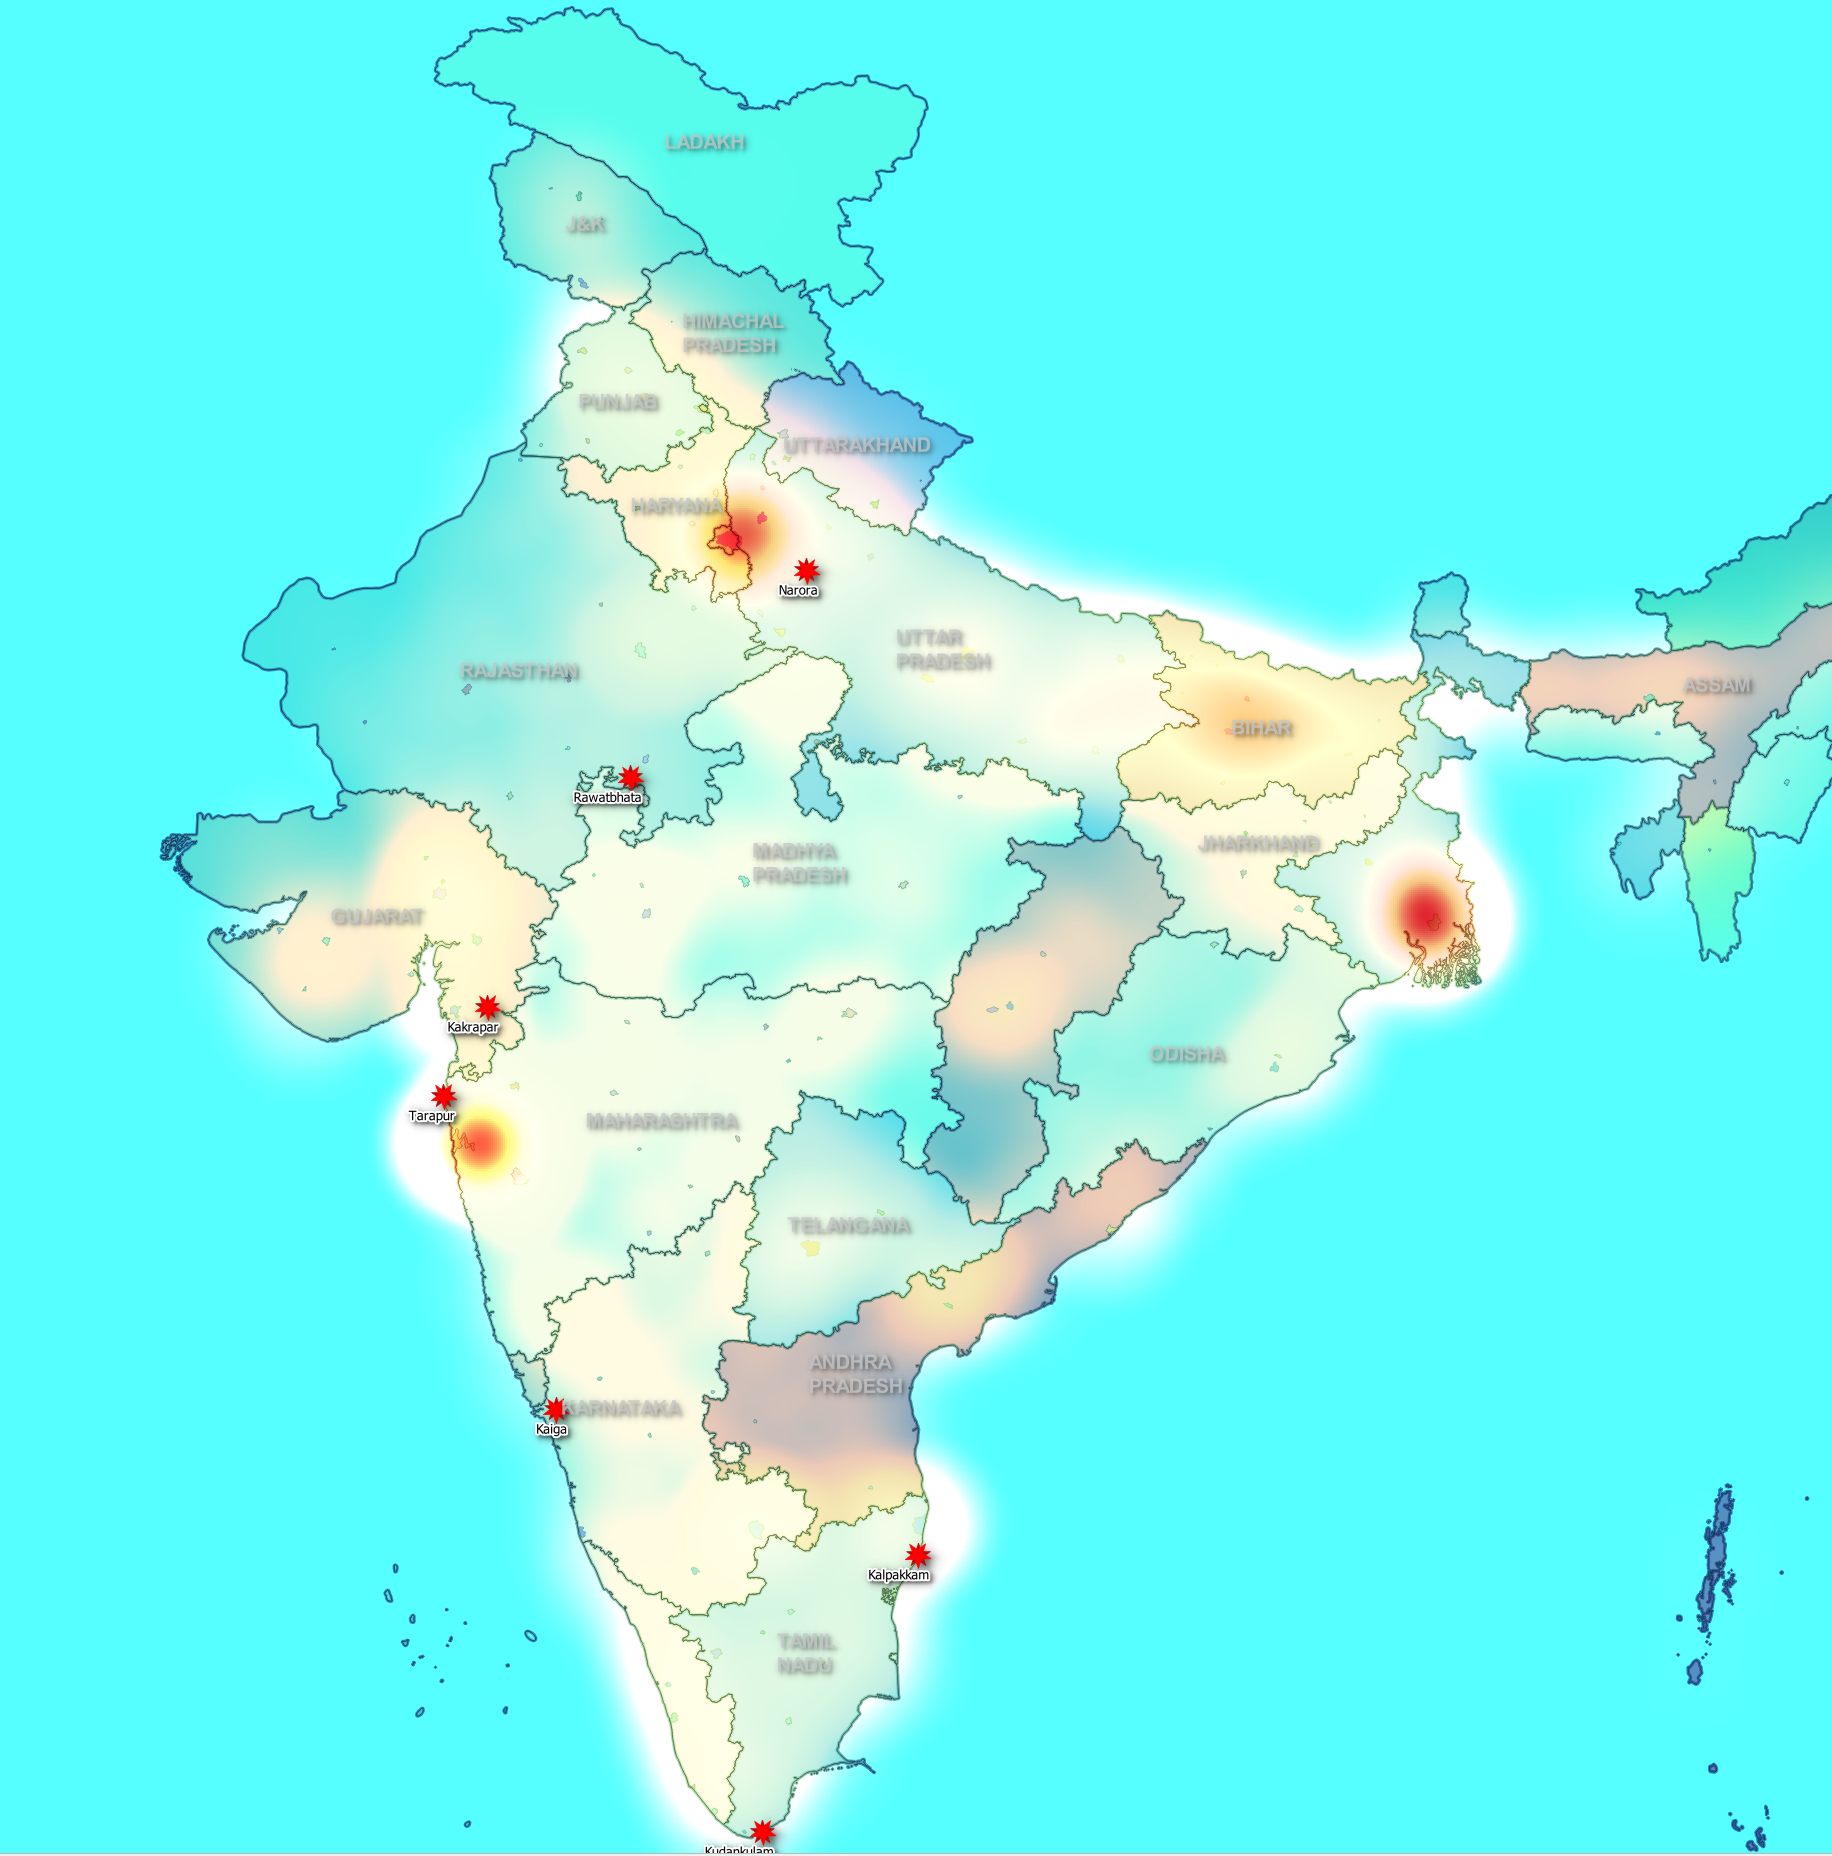
Under this programme environmental gamma radiation monitoring, using thermo-luminescent dosimeters (TLDs) around all the nuclear installations in India is being carried out by EMAD. Over large areas the TLD-recorded radiation profiles can reflect the environmental gamma
\r\nradioactivity distribution pattern and even seasonal variations in the radiation levels above ground may be delineated.
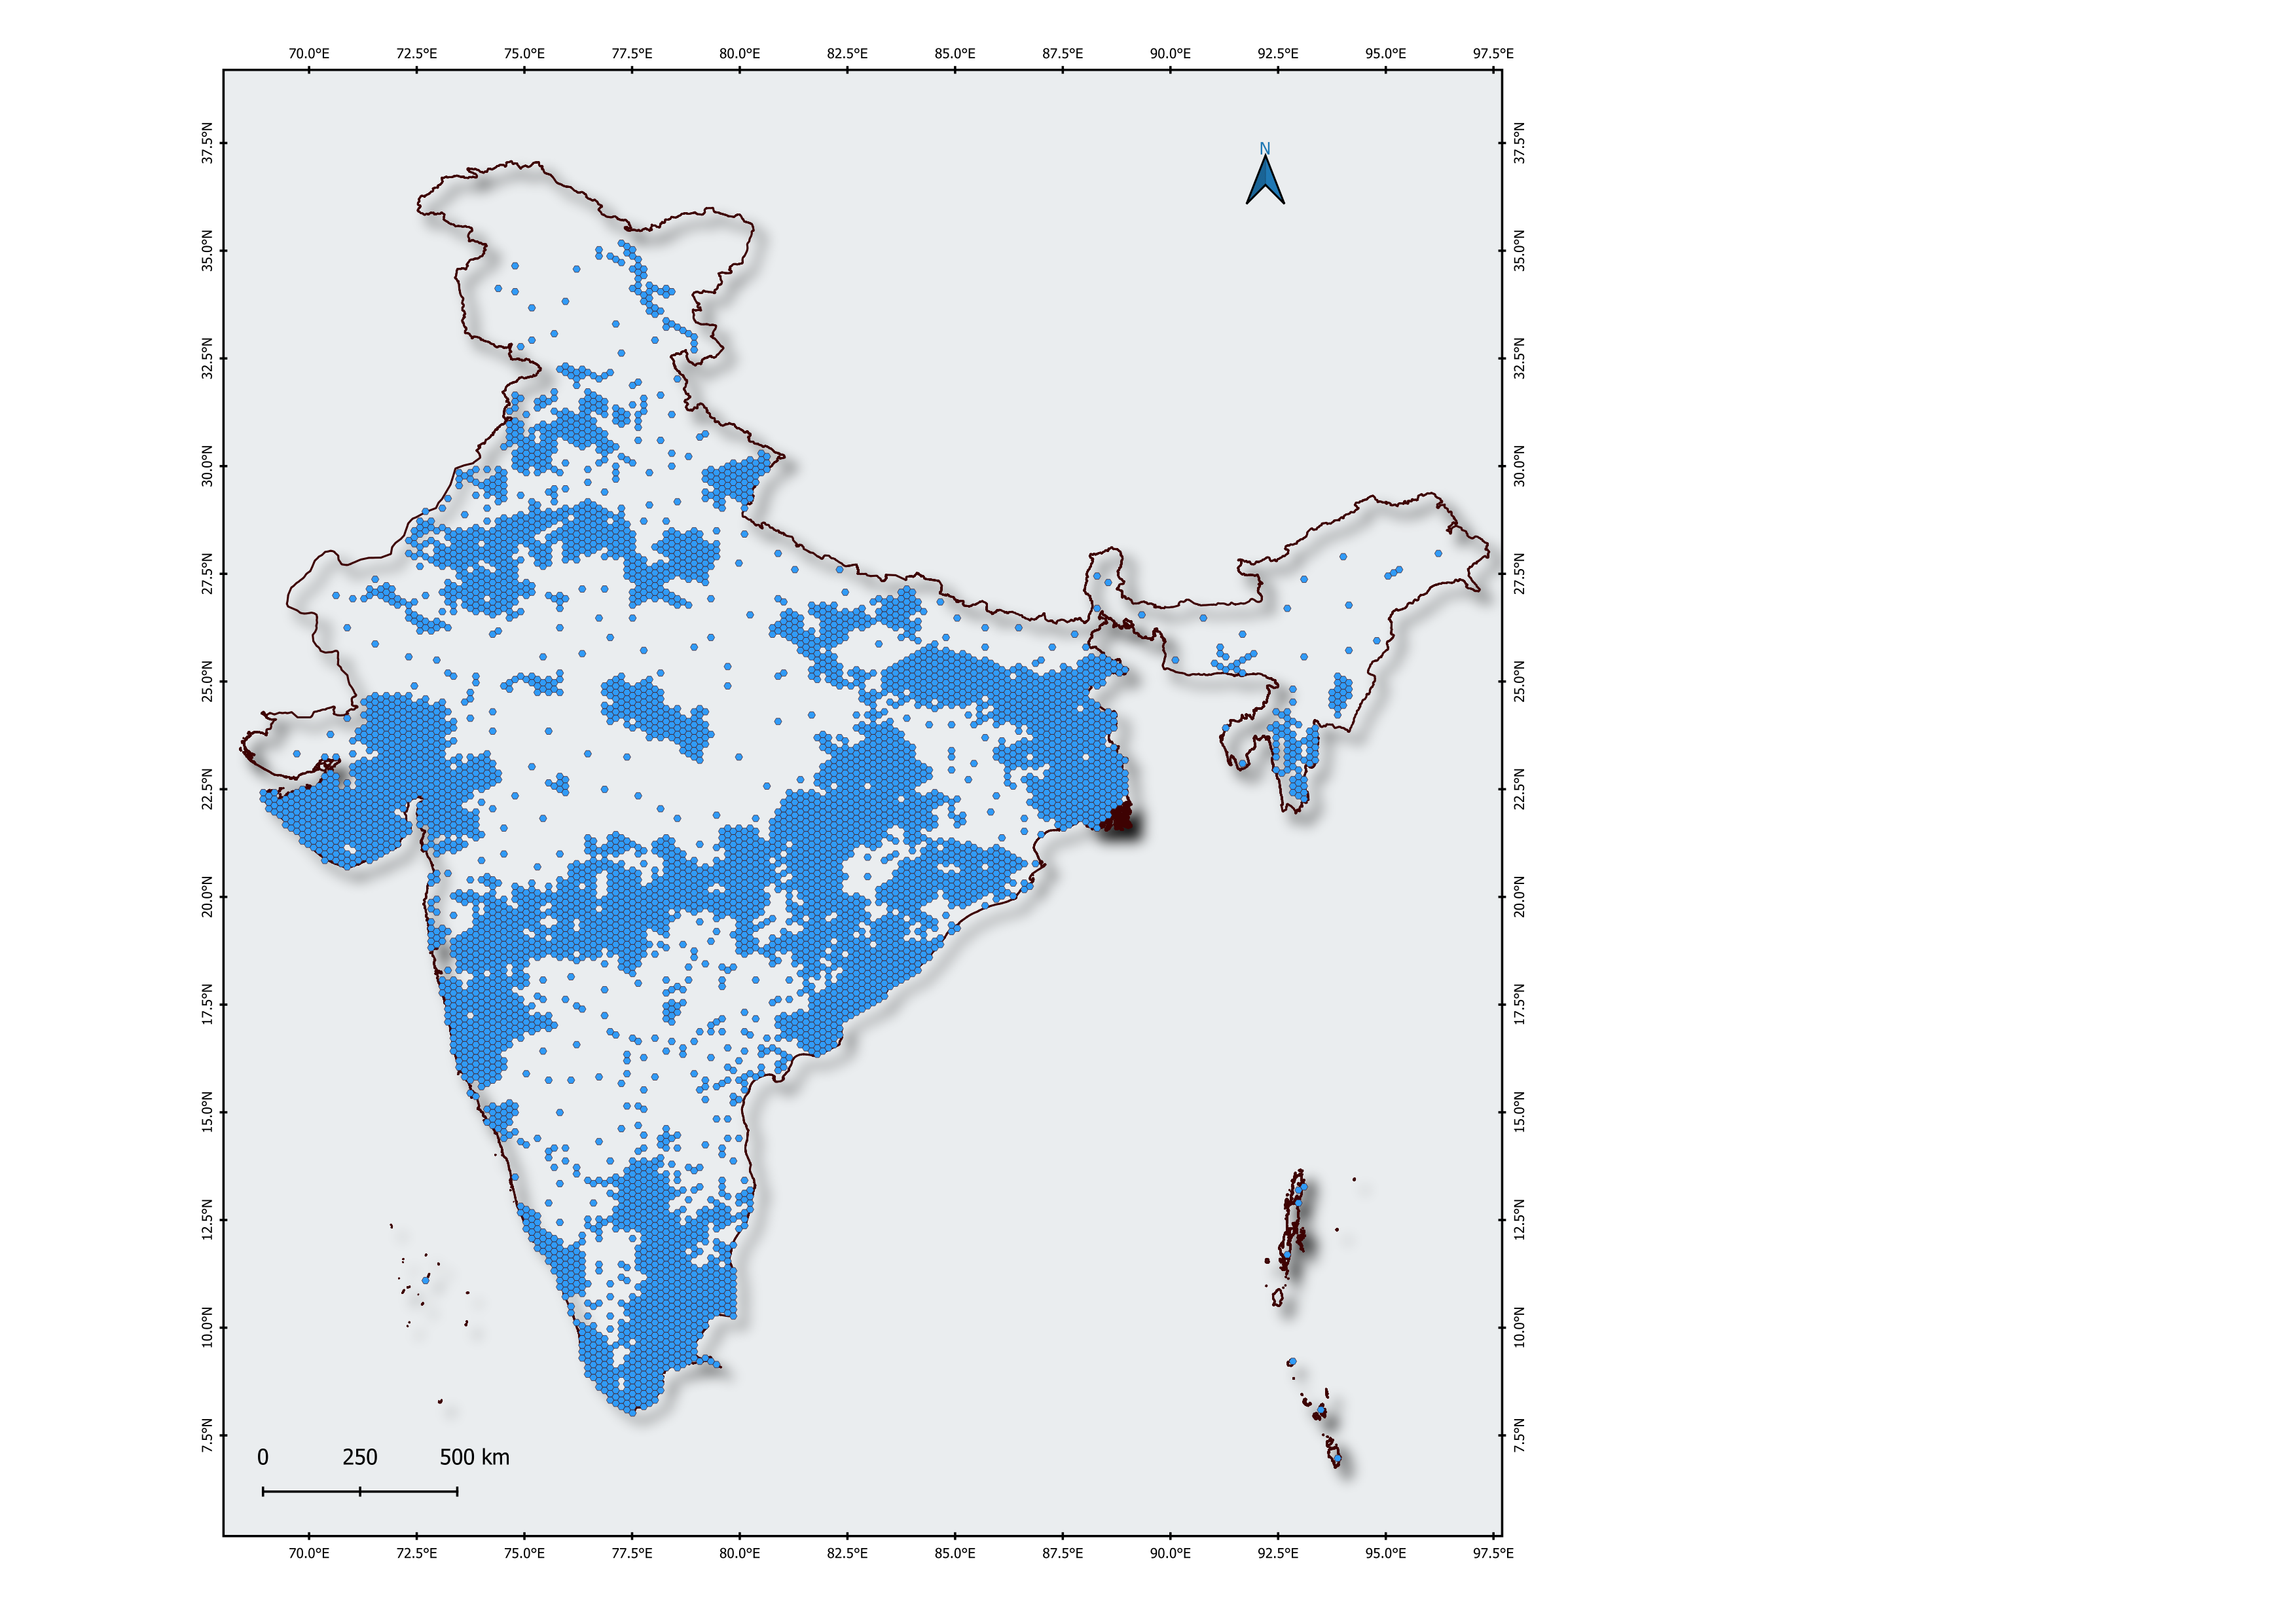
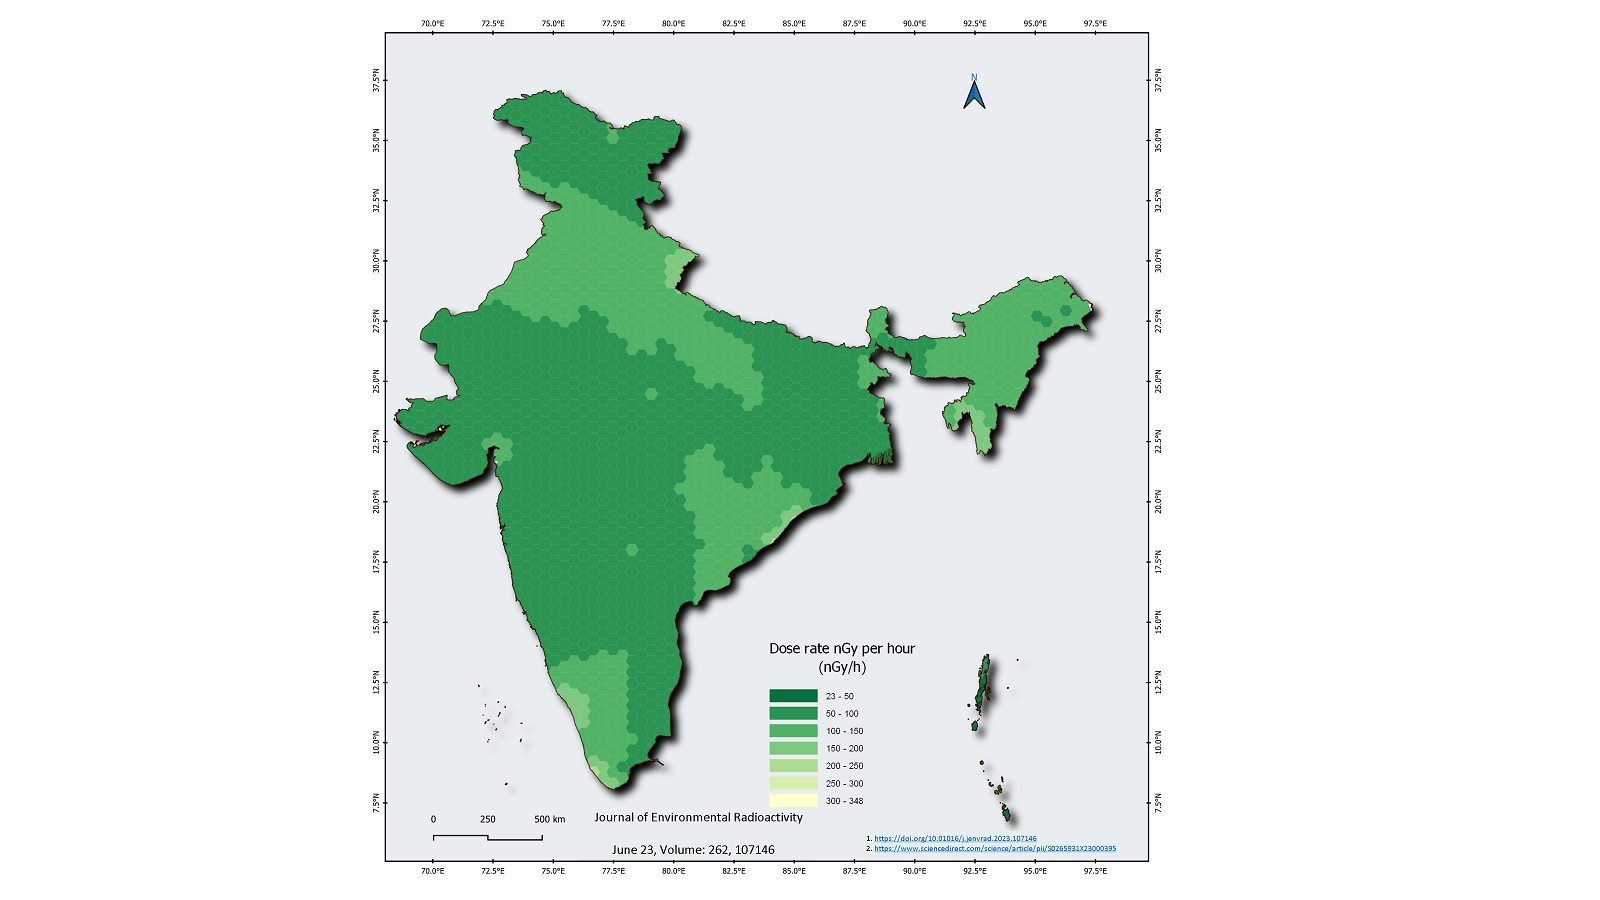
A systematic mapping of natural absorbed dose rate was carried out to assess the existing exposure situation in
\r\nIndia. The mammoth nationwide survey covered the entire terrestrial region of the country comprising of 45127
\r\nsampling grids (grid size 36 km2) with more than 100,000 data points. The data was processed using Geographic
\r\nInformation System. This study is based on established national and international approaches to provide linkage
\r\nwith conventional geochemical mapping of soil. Majority (93%) of the absorbed dose rate data was collected
\r\nusing handheld radiation survey meters and remaining were measured using environmental Thermo Luminescent
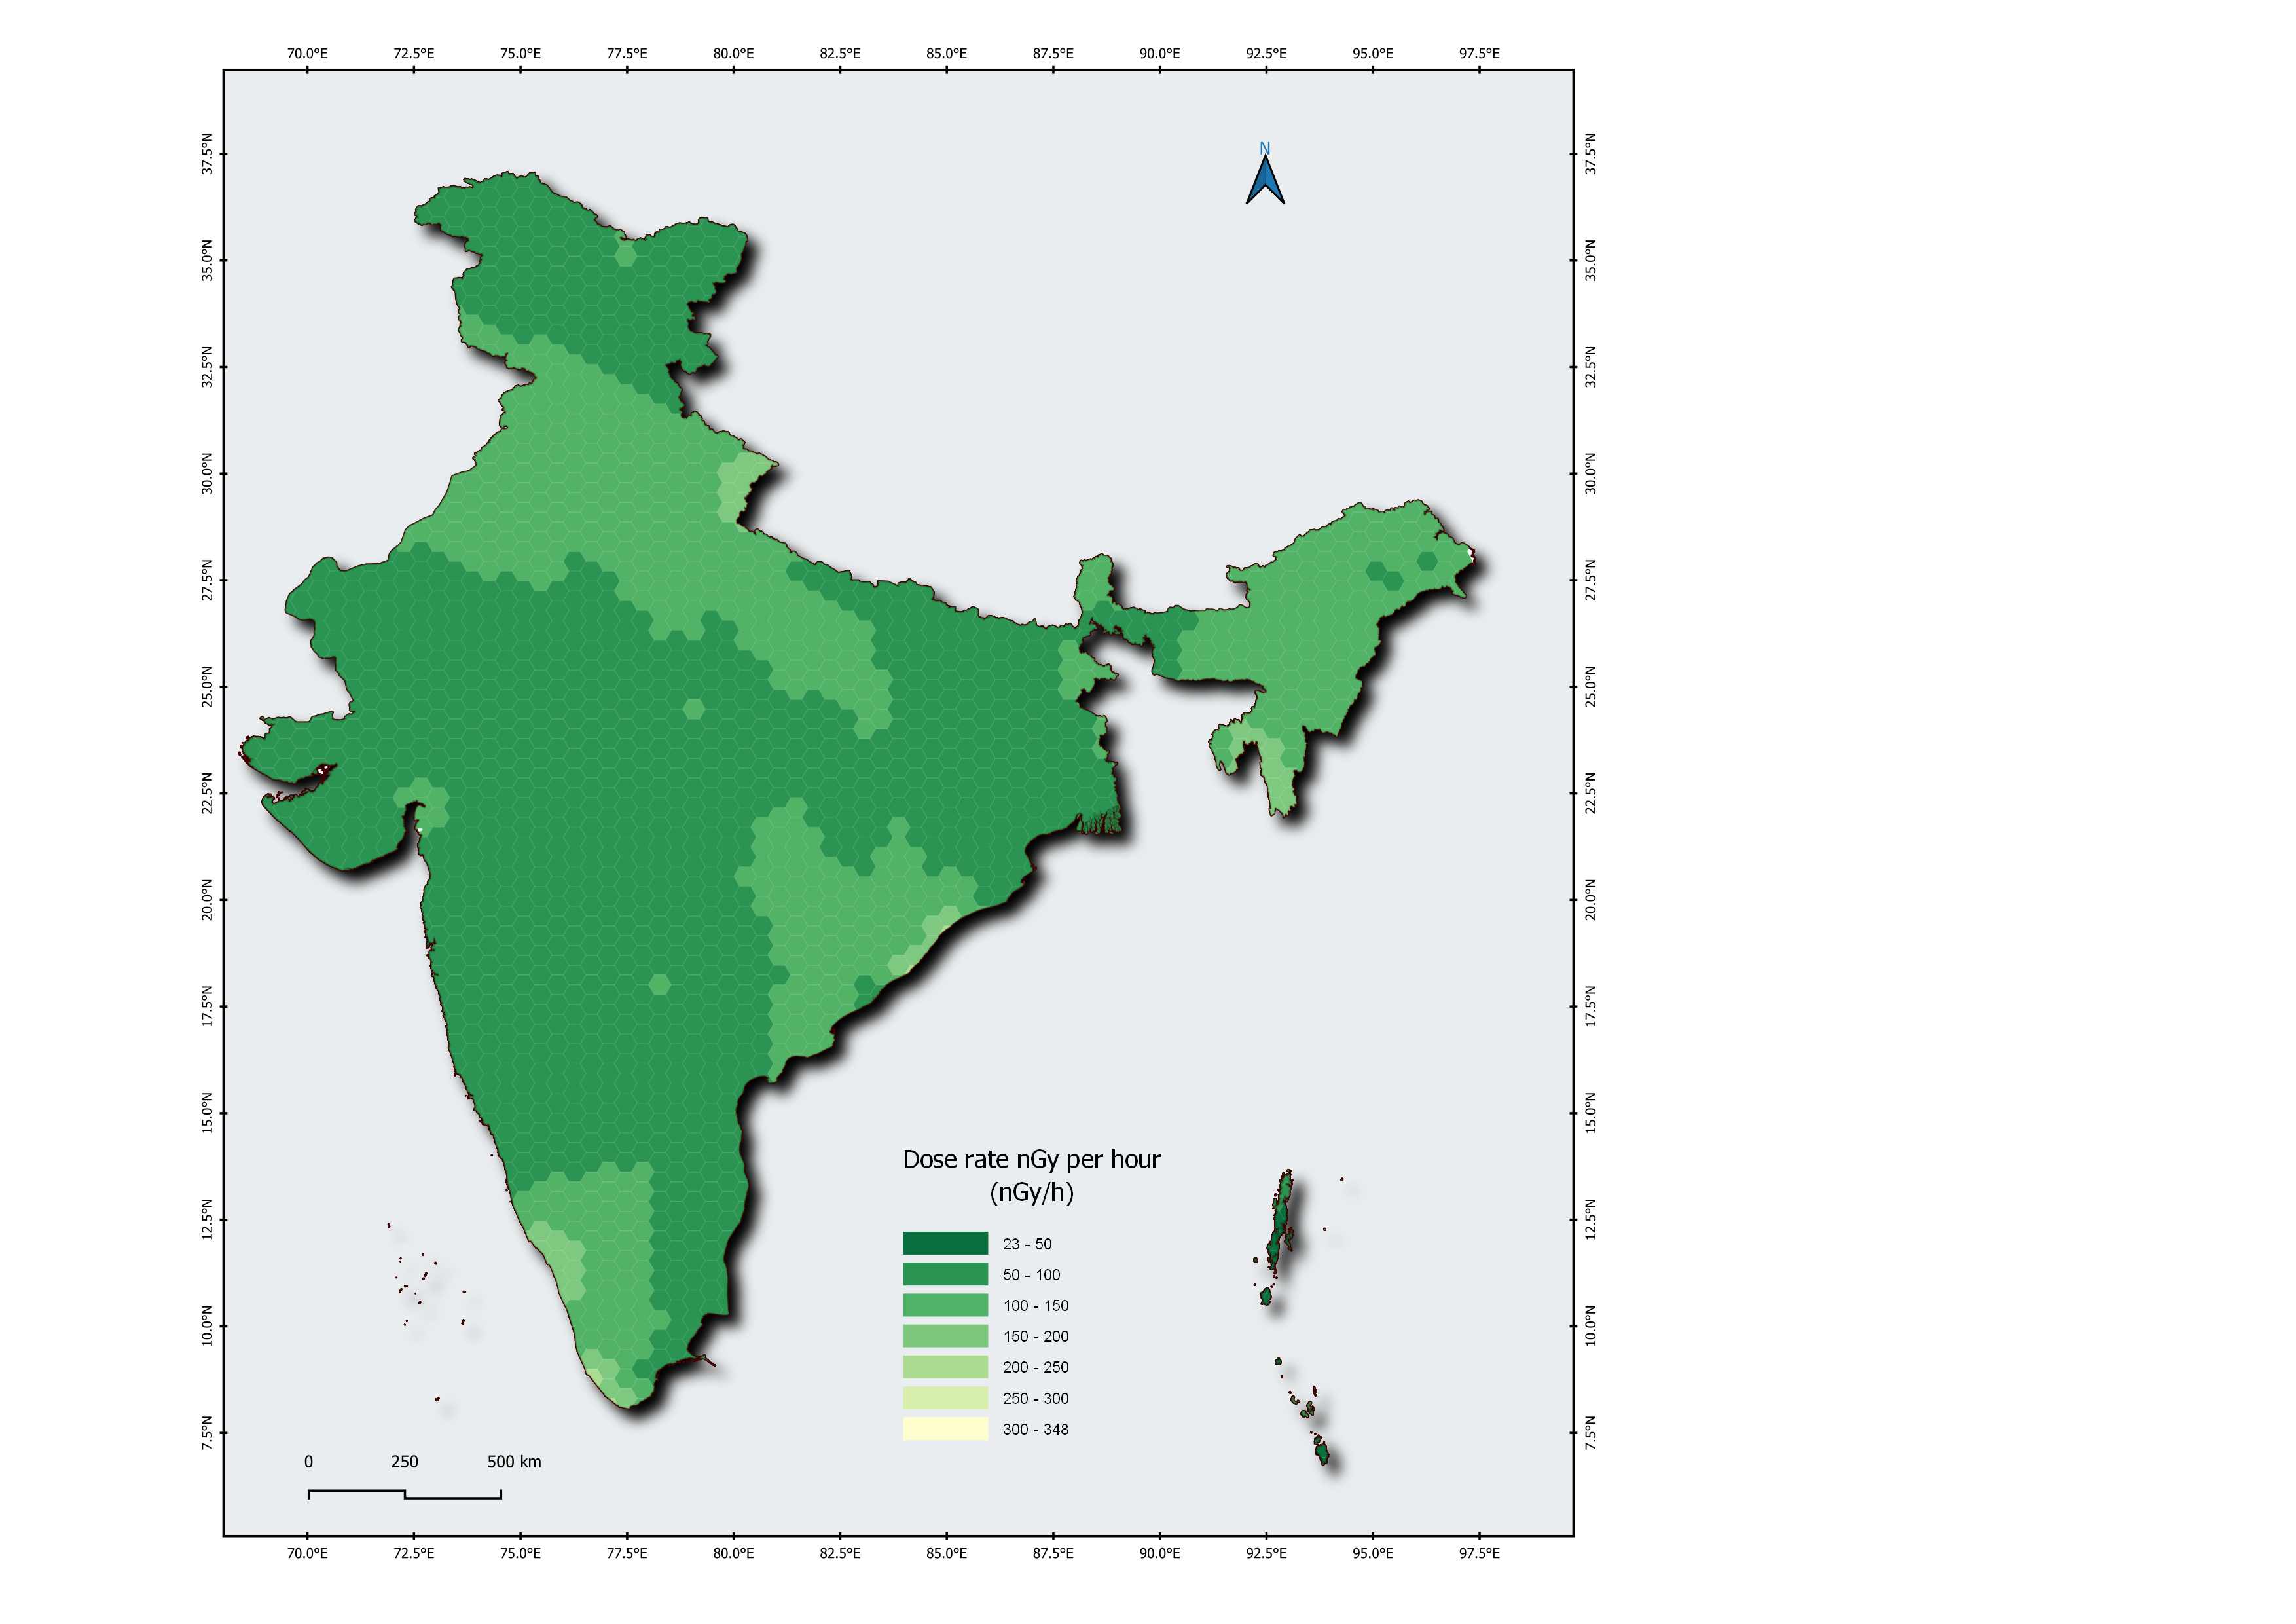
\r\nDosimeters. The mean absorbed dose rate of the entire country including several mineralized regions, was
\r\nfound to be 96 ± 21 nGy/h. The median, Geometric Mean and Geometric Standard Deviation values of absorbed
\r\ndose rate were 94, 94 and 1.2 nGy/h, respectively. Among the High Background Radiation Areas of the country,
\r\nabsorbed dose rate varied from 700 to 9562 nGy/h in Karunagappally area of Kollam district, Kerala. The
\r\nabsorbed dose rate in the present nationwide study is comparable with the global database.
A systematic mapping of natural absorbed dose rate was carried out to assess the existing exposure situation in
\r\nIndia. The mammoth nationwide survey covered the entire terrestrial region of the country comprising of 45127
\r\nsampling grids (grid size 36 km2) with more than 100,000 data points. The data was processed using Geographic
\r\nInformation System. This study is based on established national and international approaches to provide linkage
\r\nwith conventional geochemical mapping of soil. Majority (93%) of the absorbed dose rate data was collected
\r\nusing handheld radiation survey meters and remaining were measured using environmental Thermo Luminescent
\r\nDosimeters. The mean absorbed dose rate of the entire country including several mineralized regions, was
\r\nfound to be 96 ± 21 nGy/h. The median, Geometric Mean and Geometric Standard Deviation values of absorbed
\r\ndose rate were 94, 94 and 1.2 nGy/h, respectively. Among the High Background Radiation Areas of the country,
\r\nabsorbed dose rate varied from 700 to 9562 nGy/h in Karunagappally area of Kollam district, Kerala. The
\r\nabsorbed dose rate in the present nationwide study is comparable with the global database.
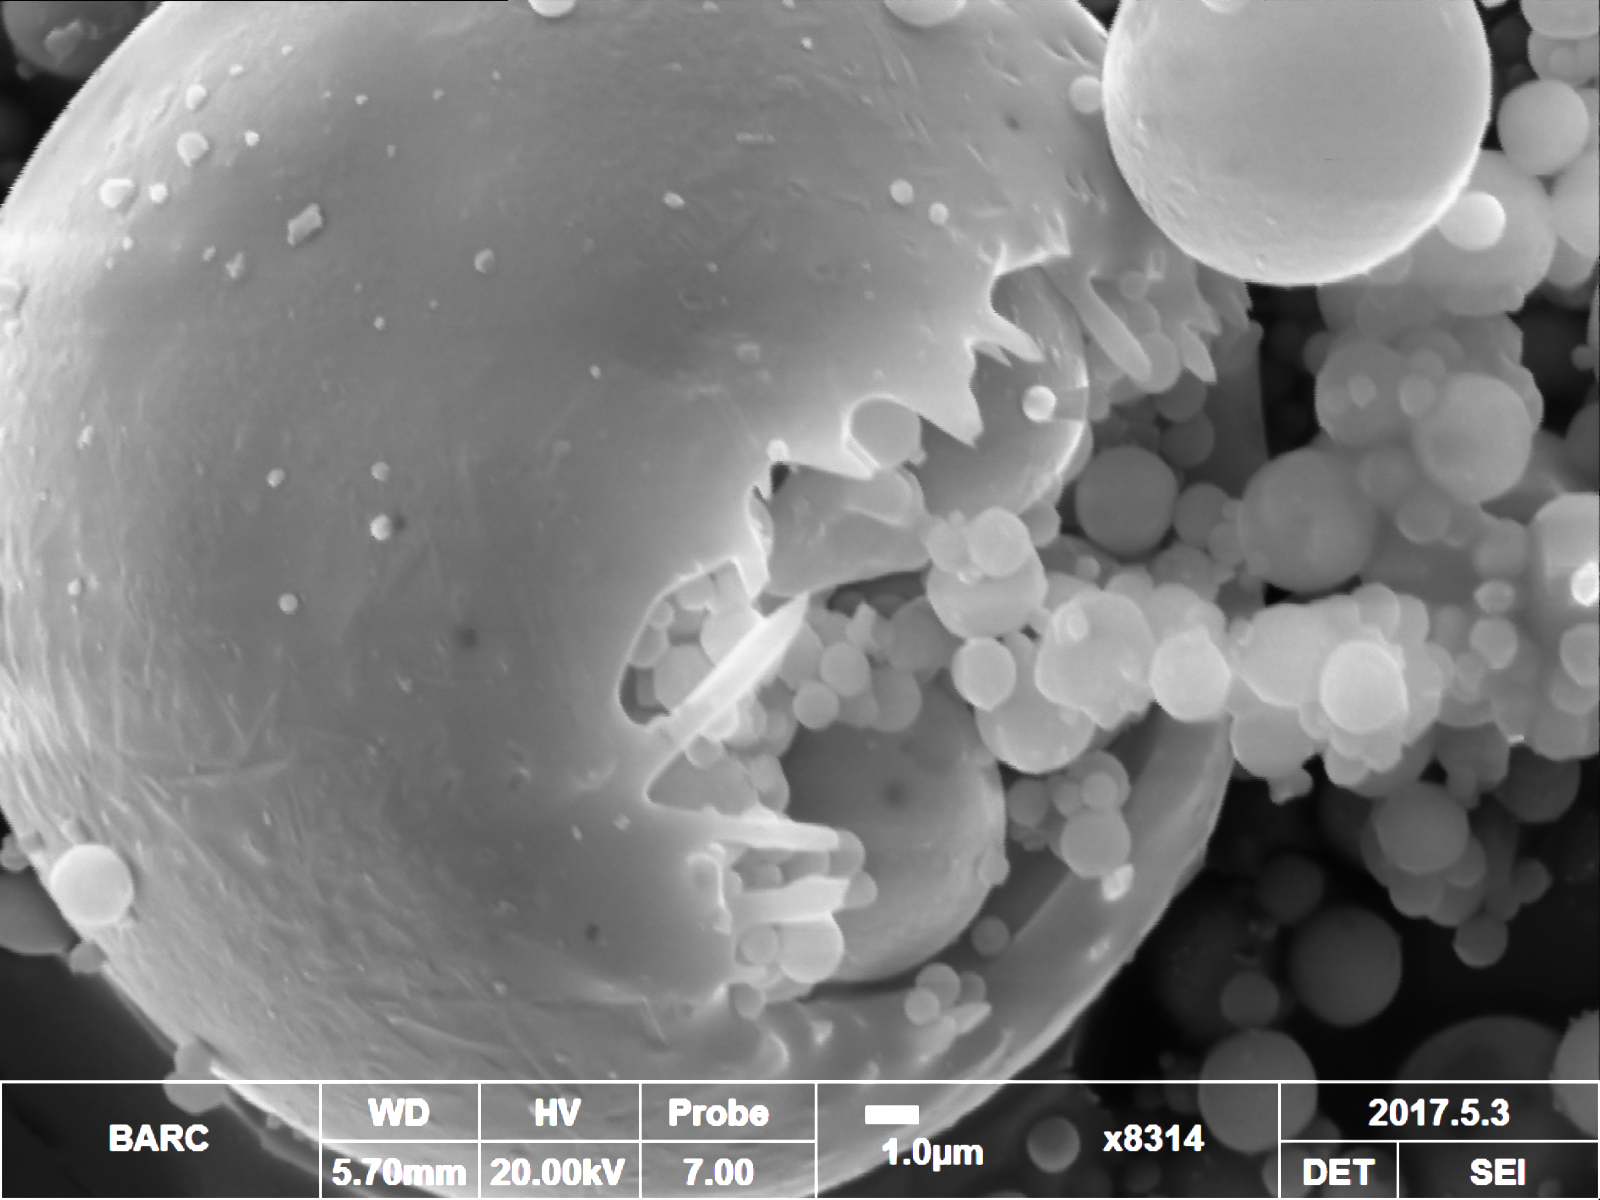
Scanning Electron Microscopy (SEM) allows for visual observation of an area of interest in a completely different way from that of the naked eye or even normal optical microscopy. SEM images show simple contrasts between organic-based and metallic-based materials and thus instantly provide a great deal of information about the area being inspected. At the same time, Energy Dispersive X-Ray Spectroscopy (EDS), sometimes referred to as EDAX or EDX, can be used to obtain semi-quantitative elemental results about very specific locations within the area of interest. EDS technique can detect elements from carbon (C) to uranium (U) in quantities as low as 0.1 wt%.
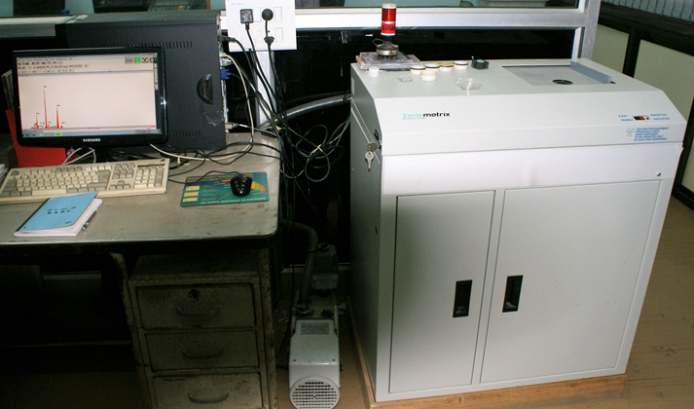
X-ray fluorescence spectrometry (XRF) is a well-established analytical technique for qualitative and quantitative elemental analysis (sometimes from Be to U) of a wide variety of samples. In particular, the truly multi-element character, acceptable speed and economy, ease of automation and the possibility to directly analyse solid samples are the most important features among the many that have made it a very mature analytical tool for routine quality controls in many industries, as well as for analytical support for the research laboratory.
A geographic information system (GIS) is a framework for gathering, managing, and analysing data. Rooted in the science of geography, GIS integrates many types of data. It analyses spatial location and organizes layers of information into visualizations using maps and 3D scenes. With this unique capability, GIS reveals deeper insights into data, such as patterns, relationships, and situations—helping users make smarter decisions.
 1990-11-30/2030-11-30
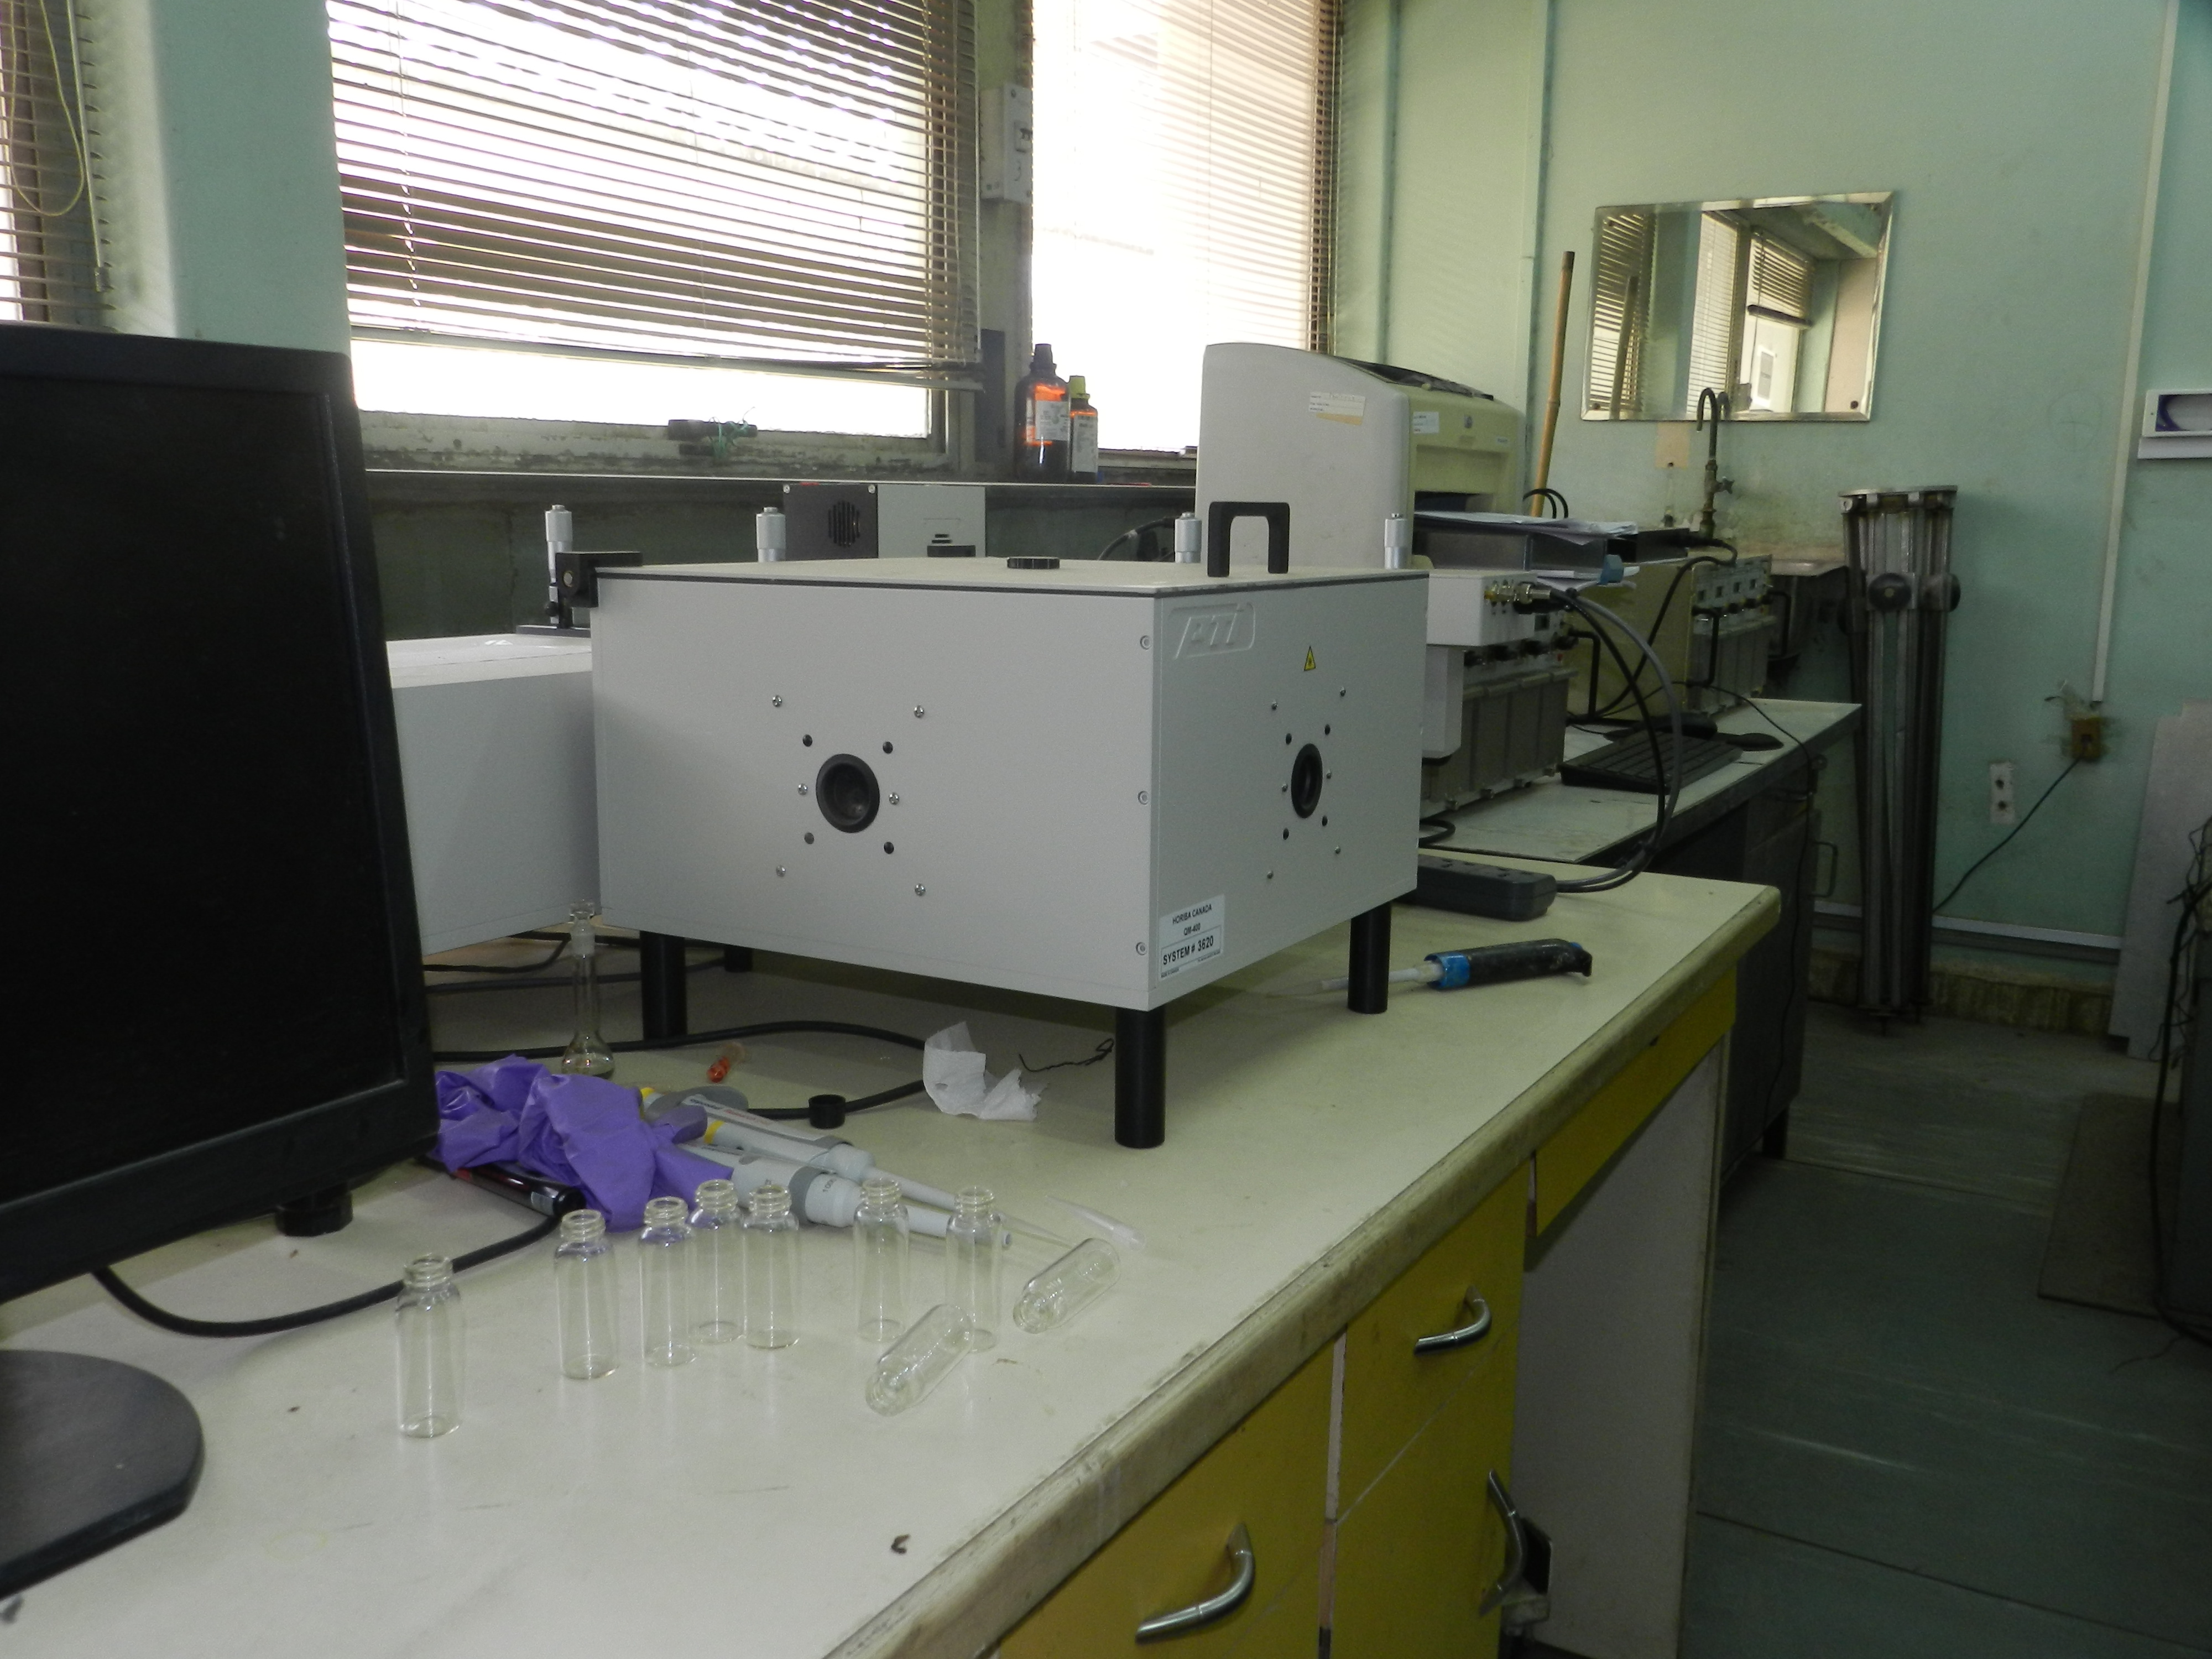
Alpha and Gamma Spectrometry based Radioactivity estimation facility for environmental samples.
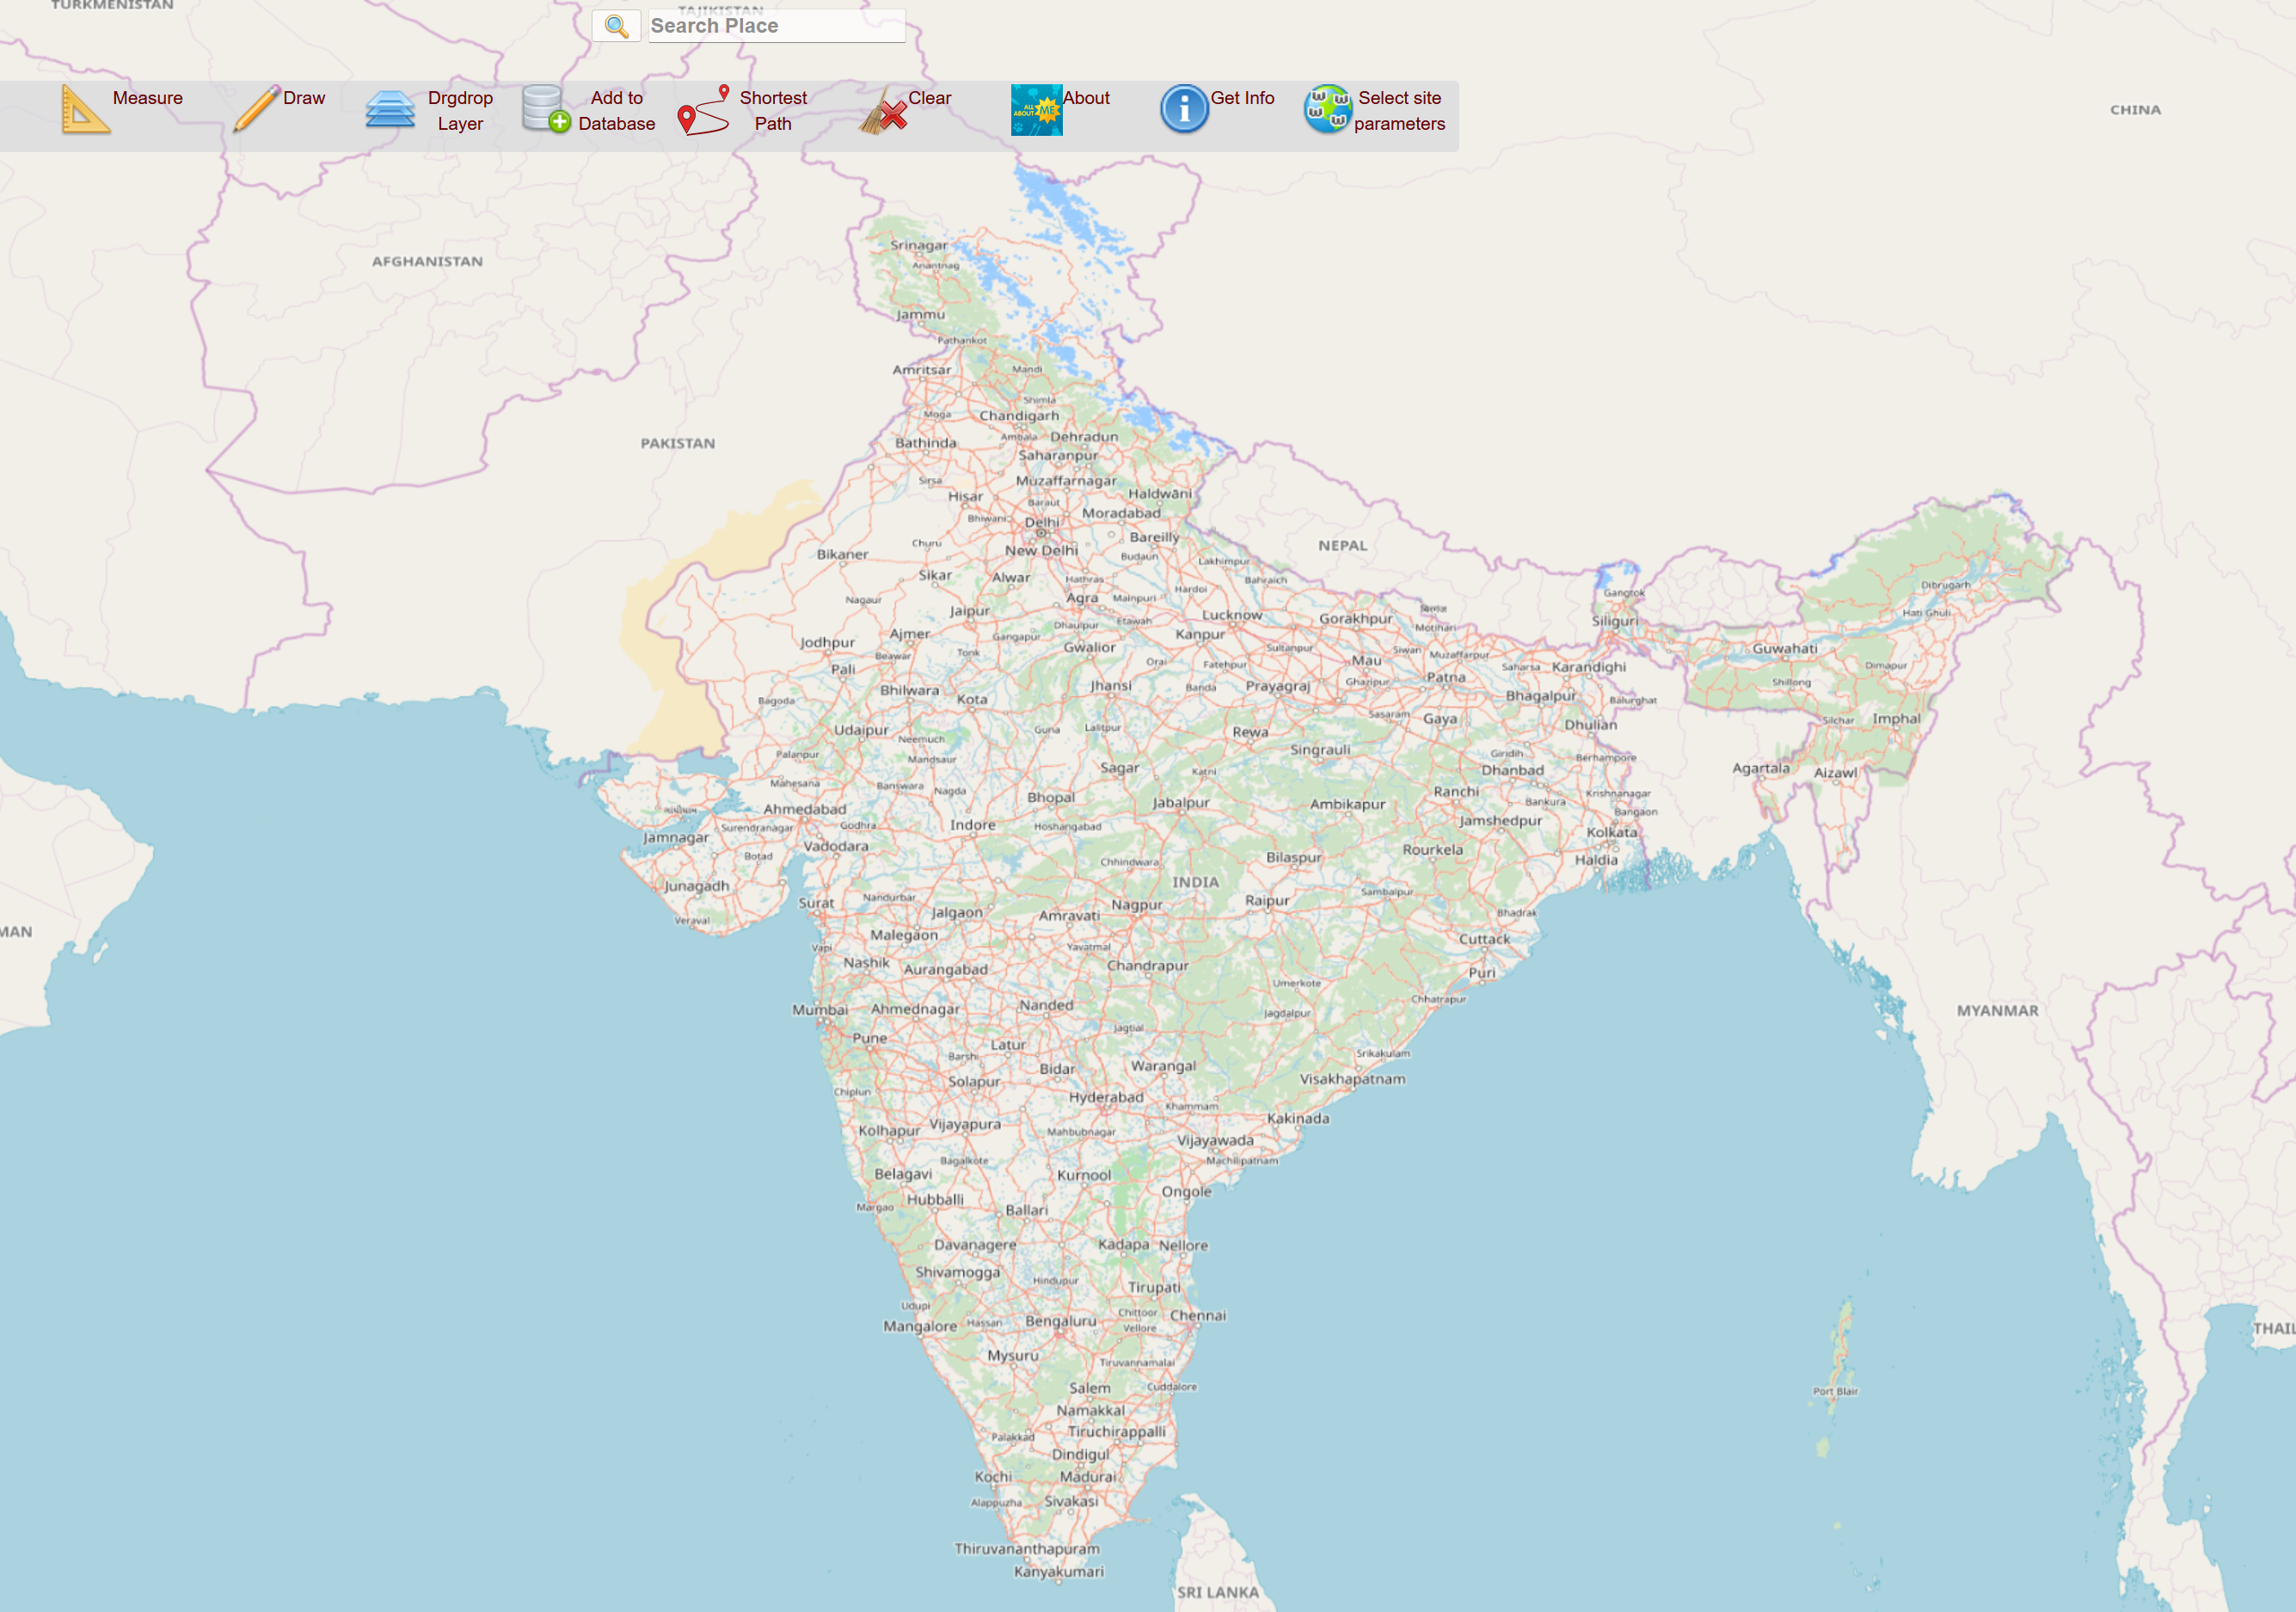
This portal is developed as a tool to browse, search and visualize data related to India. It has been developed using Free and open-source software, and data which were vilable on various public portals.